
Seven years ago, the European Central Bank pushed policy rates into negative territory. It has led to substantial redistributive effects within the eurozone banking sector
Seventh anniversary of negative rates…
It is already seven years ago, June 2014, that the European Central Bank (ECB) first imposed a negative rate on the reserves that banks hold at the ECB. The ECB started cautiously, by charging ‑10bp on reserves; the latest increase to ‑50bp dates back to September 2019. Targeted Longer-Term Refinancing Operations (TLTROs) were also announced in June 2014. Initial TLTRO operations came with a “traditional” positive interest rate: banks paid interest on their TLTRO borrowing from the ECB. Starting with TLTRO-II in 2016, the ECB added an incentive for banks to extend business and non-mortgage household credit, by making the TLTRO-rate dependent on bank lending performance. Banks could obtain negative rates up to the deposit rate (then -40bp), depending on their lending performance.
Reserves and TLTROs are distributed unevenly across the Eurozone
It is important to note that bank reserves and bank funding requirements were, and are, not distributed evenly across the eurozone. This has to do with different domestic characteristics of banking sectors and broader financial markets, and international investor preferences.
Since the onset of the pandemic, TLTRO funding has become attractive even for banks that are awash in funding and excess reserves
Generally speaking, banks in northern eurozone countries tend to hold relatively more excess reserves, while banks in southern countries have less of those, and in turn have been more keen to borrow funds from the ECB. Since the onset of the pandemic in 2020, the ECB has relaxed TLTRO lending benchmarks and rate rewards to such an extent that TLTRO funding has become attractive even for banks that are awash in funding and excess reserves. This has led to a strong take-up of TLTRO-III loans by northern banks as well since mid-2020.
Costs and gains of negative rates illustrate redistributive effects of monetary policy
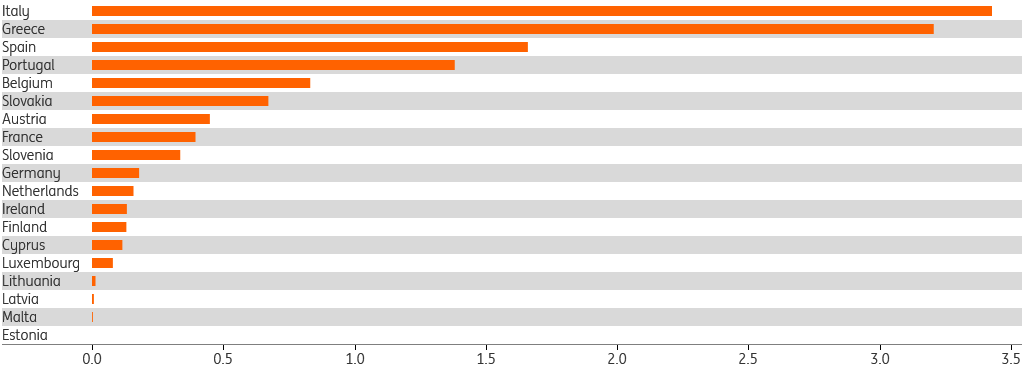
Due to the uneven distribution of reserves and TLTRO borrowing across the eurozone, the costs and gains of negative rates are very different across countries. The chart below shows the ratio of funds borrowed from the ECB (mainly TLTRO, but also including other refinancing operations) over bank reserves deposited at the ECB, per country. We take August 2019, preceding the announcement of TLTRO-III and tiered reserve remuneration in September 2019. The Greek and Italian banking sectors at that time had borrowed more than three times the amount from the ECB than they had deposited. Ratios in Spain and Portugal were well above 1. The German, French and Dutch banking sectors, on the other hand, had ratios well below 0.5, meaning their ECB borrowing was less than half (in the case of Germany and the Netherlands less than a fifth) of the reserves they had deposited with the ECB.
Ratio of refinancing operations over reserves, Aug ’19
This country-level data on TLTROs and excess reserves also allows us to attach a price tag to the observed differences. We hasten to add that this should not be seen as a country-by-country cost-benefit analysis of the full set of ECB monetary policies. Those policies have been, and continue to be, aimed at eurozone-wide inflation and economic growth. And indeed all eurozone individuals and companies have benefited. By avoiding deflation and keeping rates low for an extended period of time, the ECB has fostered economic growth and financial stability.
Pursuing monetary policy goals comes at the cost of redistributive effects, in this particular case across banks
These positive effects of broad monetary policy are not what we want to call into question here. Instead, by zooming in on the negative rate revenues and expenses associated with reserve holdings and TLTROs, we can calculate the narrow gains and losses of negative rate policies for banks. This illustrates that pursuing monetary policy goals comes at the cost of redistributive effects, in this particular case across banks.
Reserves: more excess in the North
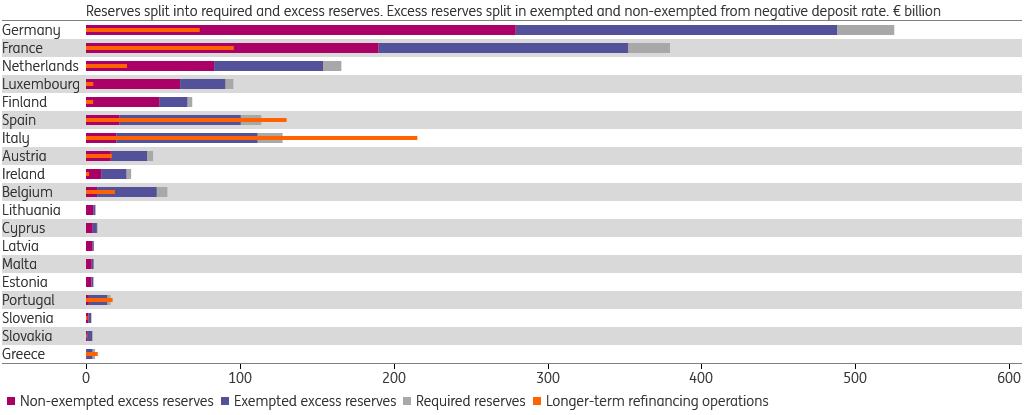
Banks have limited control over the quantity of reserves they deposit at the ECB, as we have explained elsewhere (in short: roughly half of the reserves the eurozone banking sector collectively holds, are a direct consequence of ECB asset purchases, and thus beyond banks’ control). From 2014 until October 2019, the negative rate imposed on reserve holdings was quite straightforward: it was calculated over excess reserves – reserves over and above what regulation requires banks to hold given their deposit liabilities issued. In October 2019, the ECB reduced the negative rate burden by introducing “tiering”. It started to calculate a negative rate exemption of (then and currently) six times required reserves meaning that, in total, seven times required reserves are exempted from negative rates. The -50bp deposit rate is imposed on the remaining “non-exempted excess reserves”. The chart below breaks up reserve holdings in required, exempted and non-exempted per country. It shows the situation in December 2019, the first “reserve maintenance period” to which tiering was applied. It’s clear from the chart that at that time, negative rates were still charged on a big chunk of reserves in countries like Germany, France and the Netherlands (red bars), while the part of reserves exempted from negative rates was much bigger in relative terms for e.g. Spain and Italy (blue bars). It should be noted that the situation changed markedly in 2020, when bank reserves swelled in all countries, boosted by resumed ECB asset purchases and increased TLTRO borrowing. As a result, non-exempted reserves (red bars) have now become the biggest part of reserves in all countries.
Eurozone bank reserves at Eurosystem and sums borrowed under LTROs, year-end 2019
TLTRO borrowing: more popular in the South (until 2020)
As noted earlier, the TLTRO rate has been tied to bank lending performance since 2016. Until the pandemic struck last year, the best obtainable TLTRO rate was equal to the deposit rate. Banks could (partly) offset the negative rate costs on their reserves with the negative rate revenues on TLTRO borrowing. Insofar as TLTRO borrowing exceeded (non-exempted) excess reserves, banks could even make a profit. TLTRO borrowing exceeded reserves in Spain, Italy, Portugal and Greece in the years 2016-2019.
TLTRO borrowing exceeded reserves in Spain, Italy, Portugal and Greece in the years 2016-2019
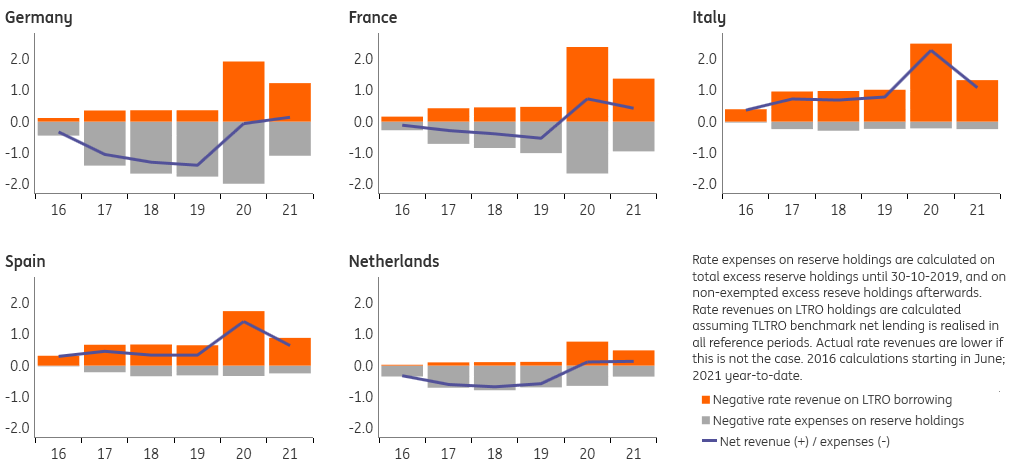
Indeed during that period, TLTRO negative rate revenues exceeded negative rate expenses on reserves for the Italian banking sector, resulting in what we call a positive narrow gain from negative rates averaging €730m/year (see chart below). For the Spanish banking sector, this was about €430m/year. The German banking sector, in contrast, booked a narrow negative rate loss of €1.1bn/year, Dutch banks around €620m/year and French banks around €360m/year.
When the pandemic struck in March last year, the ECB changed the terms of the ongoing TLTRO-III, relaxing the lending benchmark and lowering the best obtainable TLTRO rate to -100bp. This allowed banks to not only offset reserve rate costs by TLTRO rate revenues, but to actually make a positive carry – provided they met their lending benchmarks, of course. Unsurprisingly, the strong new incentive attached led to the TLTRO borrowing surge the ECB had in mind, to make sure that a lack of liquidity would not be a problem in the financial system. As a result, since June 2020, the net monthly narrow result of negative rates (TLTRO rate revenues minus reserve rate costs) has turned positive for Germany, France and the Netherlands, and has increased markedly for Italy and Spain
Annual negative rate revenues and costs for banks per country (€ tr)
The bill, please! The cumulative result of negative rate policies
The cumulative narrow result of negative rate policies differs markedly between countries, up to €10bn between Germany and Italy
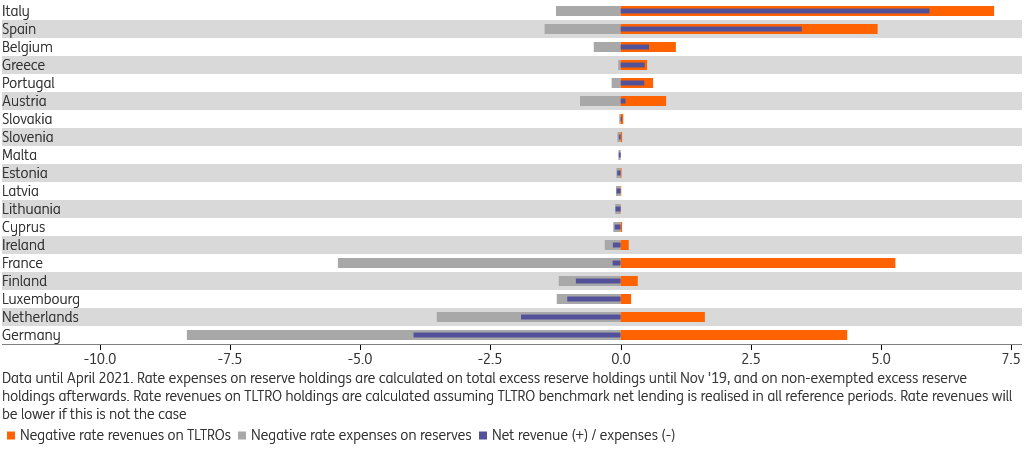
Although the monthly narrow result of negative rate ECB policies has turned positive in most countries now, the cumulative result since 2016 still differs markedly between countries, up to €10bn between Germany and Italy. The chart below shows that Italy and Spain had the highest net revenues (€5.9bn and €3.5bn per April 2021, respectively); banks in those countries both took out TLTRO loans early and had relatively low excess reserves. Banks in Germany and the Netherlands have faced the biggest net costs, as they had relatively high excess reserves and borrowed few TLTRO funds until mid-2020. The current (April 2021) net interest result is ‑€4.0bn for Germany and ‑€1.9bn for the Netherlands. France is in between these two groups (-€0.2bn), having both relatively high excess reserves but also higher TLTRO borrowing.
Eurozone banks, cumulative ECB negative rate flows since June 2016 (€ billion)
As emphasised earlier, this overview of narrow revenues and costs of rates on TLTROs and excess reserves should not be interpreted as an encompassing assessment of gains and losses of monetary policy. That said, it does show that unconventional monetary policy, like most policies, has redistributive consequences, also within the banking sector.
This article originally appeared on THINK.ING.com